
Direct answer: INE data as of August 2026 shows a stabilised distribution of around 60% fixed / 35% variable following ECB rate cuts. Fixed-rate mortgages remain in the majority, but the payment advantage between the two has narrowed considerably. The optimal choice depends on your time horizon and your tolerance for a potential Euribor rebound.
The INE publishes monthly statistics on mortgages taken out on homes by interest rate type. The chart covering 2009-2026 is one of the most complete snapshots of the financial behaviour of Spanish households and how they have responded to each ECB monetary policy cycle. We analyse it phase by phase.
Phase 1: Absolute dominance of the variable rate (2009-2015)
For more than six years, the variable-rate mortgage was practically the only option in the Spanish market: it represented between 93% and 99% of all new mortgages signed. The explanation is structural: following the 2008 financial crisis, the ECB kept interest rates at historic lows, making the spread over the Euribor the cheapest option by a wide margin. Banks also did not push fixed rates because their profit margins were higher with variable products.
Phase 2: The historic shift towards fixed rate (2016-2021)
From mid-2015 and clearly from 2016, the INE chart shows one of the most pronounced trend changes in Spanish mortgage history. In just 18 months, fixed-rate mortgages went from representing less than 10% to exceeding 40% of new sign-ups. By 2021, they already exceeded 70%. The three factors explaining this shift:
- ECB ultra-expansive policy: With the Euribor hitting historic lows near -0.50%, banks launched fixed-rate mortgages at unprecedented rates (from 1.0%-1.5% TIN over 30 years) to capture future margins and retain clients.
- Real Estate Credit Contract Law (2019): Reduced and capped early repayment fees on fixed-rate mortgages, removing the main legal barrier to their mass take-up.
- Collective memory of the 2008 crisis: An entire generation had seen their variable payments skyrocket after the Euribor peak of 5.39% in 2008. The certainty of a fixed rate gained value as an intangible asset of financial peace of mind.
Phase 3: The historic peak in fixed and minimum in variable (2021-2022)
The culminating point of the chart falls between mid-2021 and early 2022: more than 70-75% of new mortgages were signed at a fixed rate, while variable-rate mortgages had fallen to historic lows of 22-25%. This exceptional period coincides with three simultaneous circumstances:
- The Euribor in deeply negative territory (-0.50%), its all-time historical minimum.
- Bank offers of fixed-rate mortgages at historically low rates (some from 1.0% TIN over 30 years).
- A real estate market in full post-pandemic reactivation with strong pent-up demand.
Phase 4: The impact of ECB rate hikes and the recovery of variable (2022-2026)
The ECB's monetary policy reversal in 2022 triggered the sharpest shift in the chart since 2016. In just 12 months, the Euribor went from -0.50% to exceeding 4% (peak of 4.16% in October 2023).
The direct consequences on the market: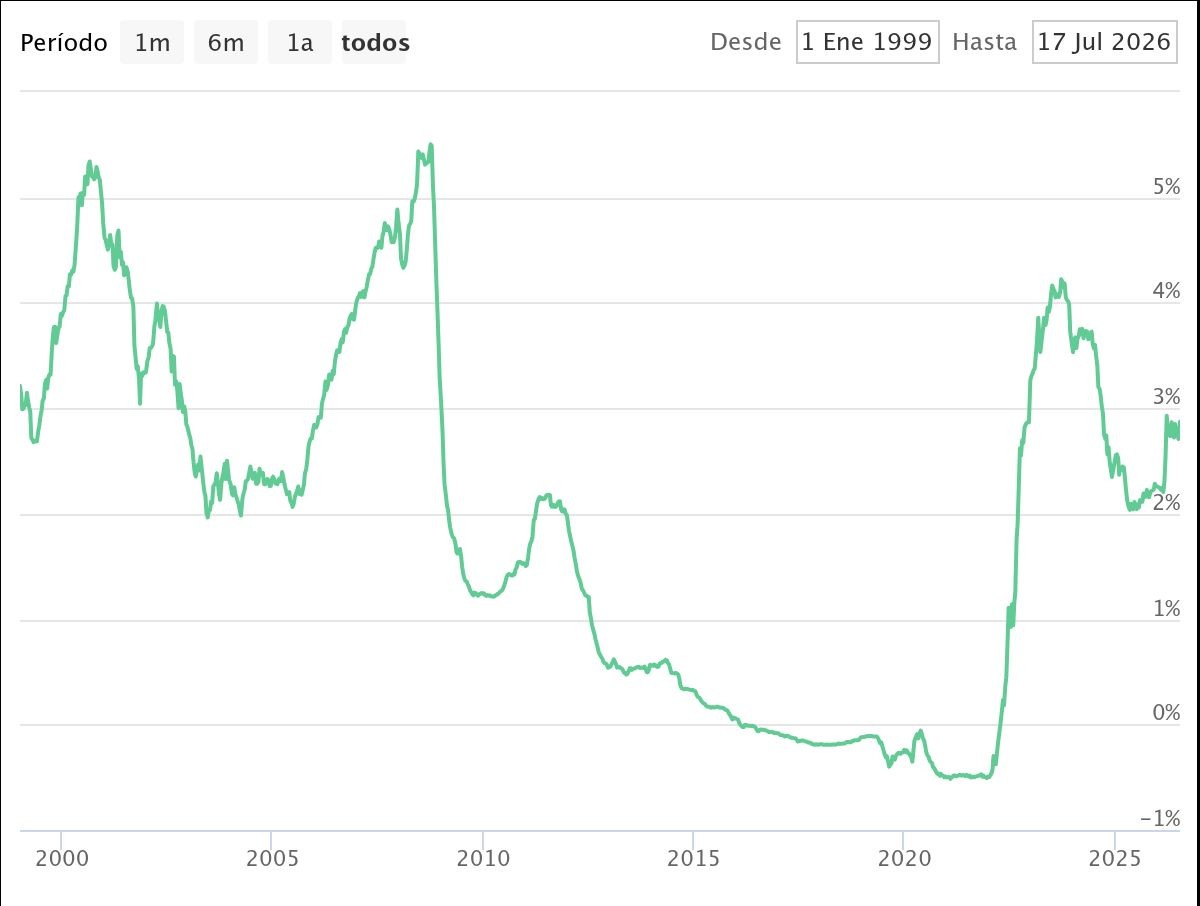
- Banks sharply increased their fixed-rate mortgages above 4% TIN, inverting the payment advantage over variable.
- The percentage of fixed-rate mortgages fell from 70% to 55-60%; variable recovered market share to 28-35%.
- The mixed mortgage emerged strongly as a third option for those seeking certainty in the early years without giving up future flexibility.
With ECB rate cuts since late 2024, the Euribor has stabilised around 2.5%-3.0%, reducing pressure on variable mortgages and also moderating the fixed rates offered by banks.
Current situation: equilibrium in 2026
The most recent INE data for mid-2026 confirms a stabilised distribution of around 60% fixed / 35-38% variable. This balance reflects the new meeting point after years of distortion: neither the absolute dominance of variable from 2009-2015, nor the supremacy of fixed from 2021-2022. The market has found a new equilibrium in which both options have valid arguments.
What to choose in August 2026?
- Fixed rate (approx. 2.8%-3.5% TIN): Ideal if you value payment certainty and have a long horizon (over 20 years). You pay a premium for stability; if the Euribor continues falling you will have paid slightly more, but if it rebounds you will be protected.
- Variable rate (Euribor + spread): The initial payment can be similar to or slightly lower than the equivalent fixed rate with the Euribor at 2.5%-3.0%. The risk is a potential ECB policy reversal if inflation unexpectedly rebounds.
- Mixed rate: Combines a competitive fixed rate for the first 5-10 years — when you pay the most interest under the French amortisation system — and variable thereafter. Offers the best risk/reward ratio for many profiles in the current environment.
Conclusion: use the INE chart as a compass, not an oracle
The historical evolution of the preferred mortgage type among Spaniards is not just a statistic: it is a snapshot of the financial conditions of each moment. The massive shift towards fixed rates between 2016 and 2022 reflected a unique period of ultra-low rates and crisis memory. The recovery of variable since 2022 reflects the normalisation of the cycle. In August 2026, the market is in balance: no option is clearly superior without knowing your specific financial profile, your term and your risk tolerance. Simulate both options with your real data before committing.